How to connect arduino to a database in this tutorial using firebase without using any Wi-Fi chip
In this tutorial, I will show you an example of an arduino project that will transmit data to firebase without using any arduino Wi-Fi chip. Disclaimer: this means that your arduino always need to be connected to your PC/laptop when transmitting the data. The purpose of this project is to show an alternative or a workaround to send data to firebase for prototyping or when ESP8266 is not available.
What you will is listed as below:
The idea is to pass the data to Python IDLE via Arduino serial monitor, then using Python to push the data to firebase. Below is an example of arduino code using two ultrasonic sensor data.
// defines pins numbers
const int trigPin = 3;
const int echoPin = 2;

const int trigPin2 = 12;
const int echoPin2 = 13;
// defines variables
long duration;
int distance;

long duration2;
int distance2;
void setup() {
pinMode(trigPin, OUTPUT); // Sets the trigPin as an Output
pinMode(echoPin, INPUT); // Sets the echoPin as an Input

pinMode(trigPin2, OUTPUT); // Sets the trigPin as an Output
pinMode(echoPin2, INPUT); // Sets the echoPin as an Input
Serial.begin(9600); // Starts the serial communication
}
void loop() {
  delay(500);
// Clears the trigPin
digitalWrite(trigPin2, LOW);
delayMicroseconds(2);
// Sets the trigPin on HIGH state for 10 micro seconds
digitalWrite(trigPin2, HIGH);
delayMicroseconds(10);
digitalWrite(trigPin2, LOW);
// Reads the echoPin, returns the sound wave travel time in microseconds
duration2 = pulseIn(echoPin2, HIGH);
// Calculating the distance
distance2= duration2/29/2;
// Prints the distance on the Serial Monitor

// Clears the trigPin
digitalWrite(trigPin, LOW);
delayMicroseconds(2);
// Sets the trigPin on HIGH state for 10 micro seconds
digitalWrite(trigPin, HIGH);
delayMicroseconds(10);
digitalWrite(trigPin, LOW);
// Reads the echoPin, returns the sound wave travel time in microseconds
duration = pulseIn(echoPin, HIGH);
// Calculating the distance
distance= duration/29/2;
// Prints the distance on the Serial Monitor
Serial.println("{'enter':"+ String(distance) +",'exit':"+ String(distance2) +"}");
}
the arduino serial println will display "{ 'enter' : 123, 'exit': 123}". The python code below will catch the output from the serial. For this you need to download python serial library and import it to python. You will also need firebase admin library to be downloaded and imported to python for this to work. Lastly, you need to have your firebase console ready and configured.
In line 5 to 11 any library needed is imported. note that on line 5 import serial, line 6,10,11 is the firebase import. Line 13 and 15-17 shows how the firebase credential declared and initialized. Line 19 making reference to the database. initialze the serial at line 21 with parameter COM6 refer to the arduino terminal. On line 42 is how to fetch the data from serial. Now the data that is acquired is an object containing enter and exit value. On line 47 and 48 is how you extract the value. Line 37 and 38 is how you push or update to firebase.
1 Comment
Project Aim
This monitoring system is made for clients who are having a small/big farms, nursery and estate plantation. The aim is to create a user friendly based system for the users to view the level and indicator of air quality in greenhouse. The function of this monitoring system is to transmit and receive data from greenhouse. The data will be used as the target for analysis for the efficient use of the running the greenhouse, it is useful for analysis of the factors to ensure a proper greenhouse system. The system will monitor the air quality such as temperature, humidity and carbon dioxide which are very important factor for plants growth.
Whats needed:
DHT11 is connected to digital pin 7 while MQ135 is connected to analog pin A0
the arduino code for the sensor is as below:
#include <dht.h>
#include "MQ135.h"
dht DHT;
#define DHT11_PIN 7

int analogPin = 0;
MQ135 gasSensor = MQ135(analogPin);
long prevMillisDHT11 = 0;
long DHT11Interval = 1000;
#define RZERO 310 //76.63
int i = 0;
double result;
double rzero;

void setup(){
  Serial.begin(9600);
}

void loop()
{
  unsigned long currentMillis = millis();

  if(currentMillis - prevMillisDHT11 > DHT11Interval){
    if (i==0) {
   rzero = gasSensor.getRZero(); // float
 }
 if (i>0) {
   result = gasSensor.getRZero();
   rzero = (rzero + result)/2;
  }
  i++;
    float ppm = gasSensor.getPPM();
    int CO2 = (int)(ppm*1000);
    int chk = DHT.read11(DHT11_PIN);
    char text[40];
    int humidity = DHT.humidity;
    int temperature = DHT.temperature;
    sprintf(text, "%d,%d,%d\n",temperature, humidity,CO2);
    Serial.println(text);
    prevMillisDHT11 = currentMillis;
    }
}
in the eclipse I create a telemetry viewer like so:
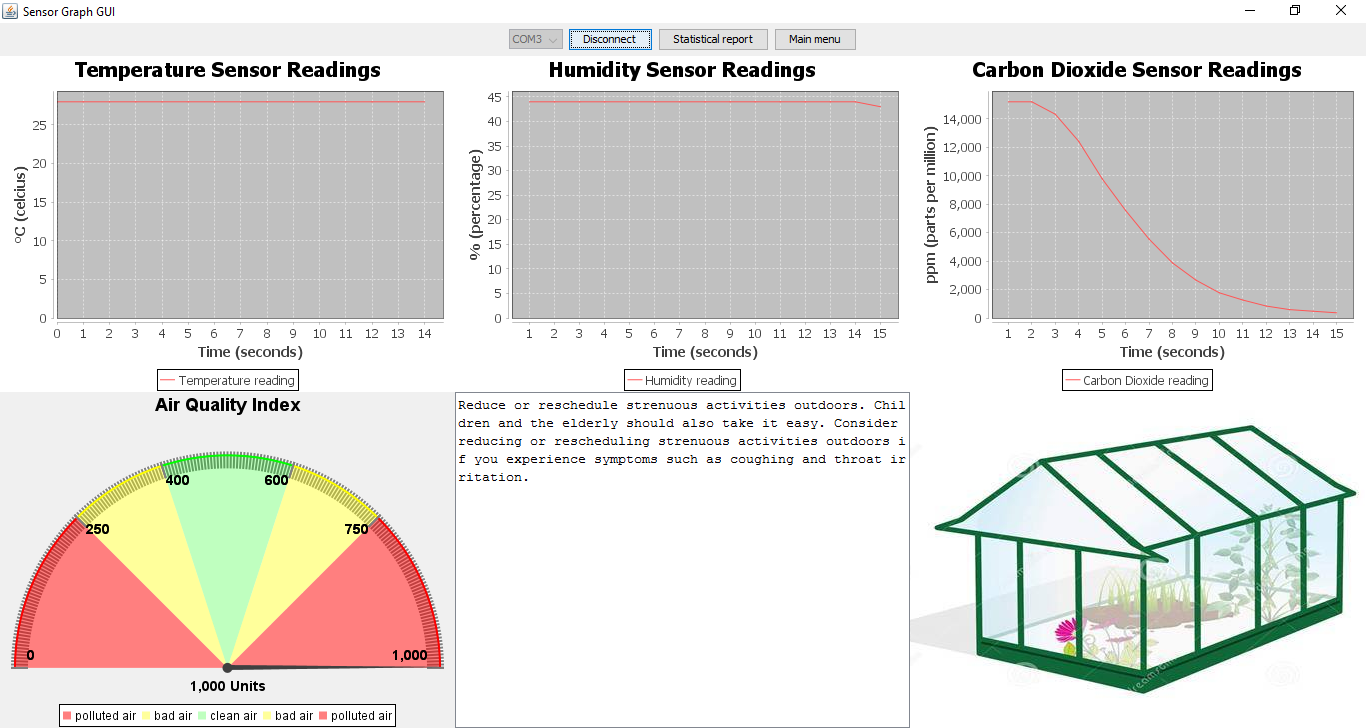
telemetry viewer
the important codes to get the data from arduino serial monitor in java
This connect function is the heart of our software. The function is to detect the connection of Arduino from the Pc USB port and displaying the real-time graph, storing the data in database and displaying suggestion appropriately. On line 8 to 12 is to get all available port and to connect to open port which is supposedly the Arduino. Line 16 to 43 is a new thread where all the main function lies. The scanner on line 21 will read all incoming line from Arduino which consist of three coma separated values, this will be assigned to dataset array. Line 23 to 25 will assigned those value to appropriate variables. Line 26 retrieve the current date and time value from the system. While line 27 to 28 add the three values to the respective charts. On line 30 the function ‘calculate’ takes 3 parameters from temperature, humidity and CO2 to calculate the air quality value which will be assigned to double variables AQI.
The dial on line 412 will take the parameter AQI to be displayed on the dial. The ‘suggestionview’ function handles which suggestion to show accordingly. while, ‘intervalMail’ function checks whether the indicator is at critical level for specific duration set by the admin. ‘sendMail’ function will send e-mail to the targeted recipient when allowed by the ‘intervalMail’ function. On line 37 the whole window refreshed. On line 38 the data measured by all three sensors will be uploaded to database. On line 48 the else block will trigger if the disconnect button is clicked. Results will be chosen port closing and all 3 graph will be reset.
I enclose the arduino and its sensors using some cereal box and dish-washing sponge to make it less fragile and more managable
|
Project portofolioShowcasing some personal projects, example or tutorial related to programming and IOT throughout competitions and assignments. ArchivesCategories |
 RSS Feed
